
"farsight simplifies your trading"
Many of us choose to trade because we aspire to break free from our day jobs and work on our own schedules. However, becoming a profitable trader often requires hours of research and analysis. Farsight significantly reduces screen time and enhances accuracy and consistency. It scans your chart for trade entries and alerts you with an up or down arrow to signal potential trades. Farsight advises on when and where to place your orders, displaying a price zone in the ideal location for profit and stop-loss targets. You simply place a trade and set conditional orders to exit your position when the price reaches these zones. It's a set-and-forget system. There are no licensing fees, recurring payments, or subscriptions. Once you purchase the programs, they are available for instant download and can be used immediately, provided you have a Thinkorswim investment account.


YELLOW SIGNALS MARK PULLBACKS IN STRONG UP OR DOWN TRENDS
The yellow signals mark potential pullbacks in strong trends, or likely reversal locations when the market is over extended. They can be traded, but happen very quickly. They make great scalping opportunites.

GREEN AND RED SIGNALS MARK REVERSALS DURING VOLATILE MARKET CONDITIONS
The green and red signals are used to catch quick and powerful moves during choppy market conditions when price is not trending.

CYAN SIGNALS MARK STRONG BUYING OPPORTUNITES IN AN UPTREND
The cyan signals are used to catch pullbacks just before a strong burst of momentum pushes price higher in a Bullish trending market environment.

MAGENTA SIGNALS MARK STRONG SELLING OPPORTUNITES IN A DOWNTREND
The magenta signals are used to catch pullbacks just before a strong burst of momentum pushes price lower in a Bearish trending market environment.

WYCKOFF based MARKET PHASES WILL GIVE YOU THE CURRENT FORECAST AND MARKET OUTLOOK
Think of this as a weather forecast. Farsight will use this to make market predictions. The current market phase will be displayed at the top left corner of each chart. There are 5 unique phases.

profit targets and stop-losses are plot directly on the charts
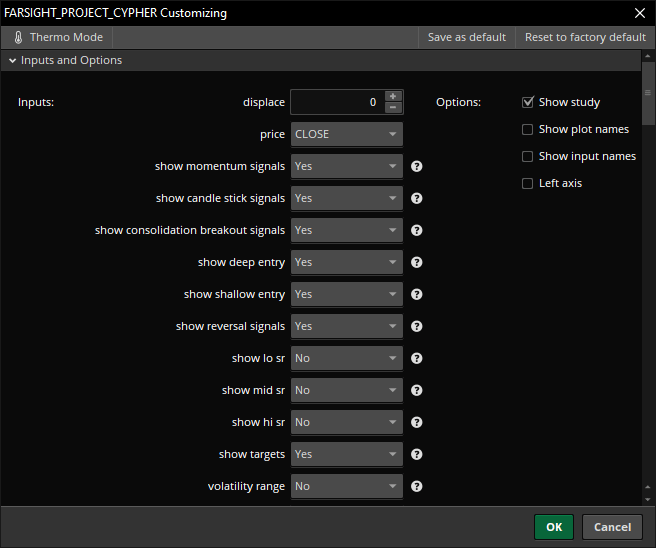
No need to guess when to get out of a trade. The target zones are posted right on the charts. Price action, volatility, and range detection give you ideal zone placement. All is adjustable on the study input screen in ThinkorSwim.

The Options Expansion will give you ideal options strategy advice
No need to guess what type of options strategy to use. This add-on for Farsight will scan Implied Volatility, and use Farsight's Market Phase analysis to tell you which strategy to use.


The trade assist pro will give you an increased edge
Get Pro Entry Signals, and realtime backtesting results. Adds features to optimize performance, trading windows, and curve fit Farsight to work effectively in all market conditions. Let's you know exactly how your trading would have performed, and displays realtime backtested profit in the form of a graph at the bottom of your chart. You can select which blocks of time you want to see profit results for, and also allows you to skip earnings announcements, adjust stops, targets, and adds various exit conditions depending on market reversals. Also allows you to use dynamic or static stop losses and targets, and further filter trades based on even larger market trends. You can even test sell only, buy only, or both sell and buy side strategies at the same time.

Oracle now available
Fundamentally the same as Farsight, but different in its approach. I went back to the drawing board to see how I could make Farsight even better. I wanted the user to be able to understand what it was that the program was looking for, and teach the user how to find trade setups on their own. I also wanted to simplify the code so that it could be used in ThinkorSwim's scanner. Lastly I wanted the user to be able to see the market structure and cycle analysis that the code was building and break it down to a more usable way.
I'm proud to say that after starting over and restructuring the entire program, this is a completely new model. It uses different methods to read the price action in the markets, and breaks it down into a market structure that allows the user to see in depth market phase and cycle analysis that acts like an X-ray allowing you to peel back the layers of the market and truly understand what price is doing. From there it combines elements from Harmonics, Elliot Wave Theory, Wyckoff Market Phases and more, and displays the price wave counts directly on your chart.
Oracle features
scan for entries
stop style selection
swing or scalp strategies
filter trades based on time of day
target/stops automatically generated
view market cycles, structure, wave counts, phases
filter trades based on days before/after/during earnings
filter trades based on different order types/entries
chart bubbles and labels for phases/cycles
new buy the dip/sell the rip strategy
complete plot/chart customization
trade/strategy assistant
trend filter selection
target adjustment
audible alerts
+much more


